1. Introduction
1.1. What is IDS?
An intrusion detection system (IDS) monitors network traffic and monitors for suspicious activity and alerts the system or network administrator. In some cases, the IDS may also respond to anomalous or malicious traffic by taking action such as blocking the user or source IP address from accessing the network.
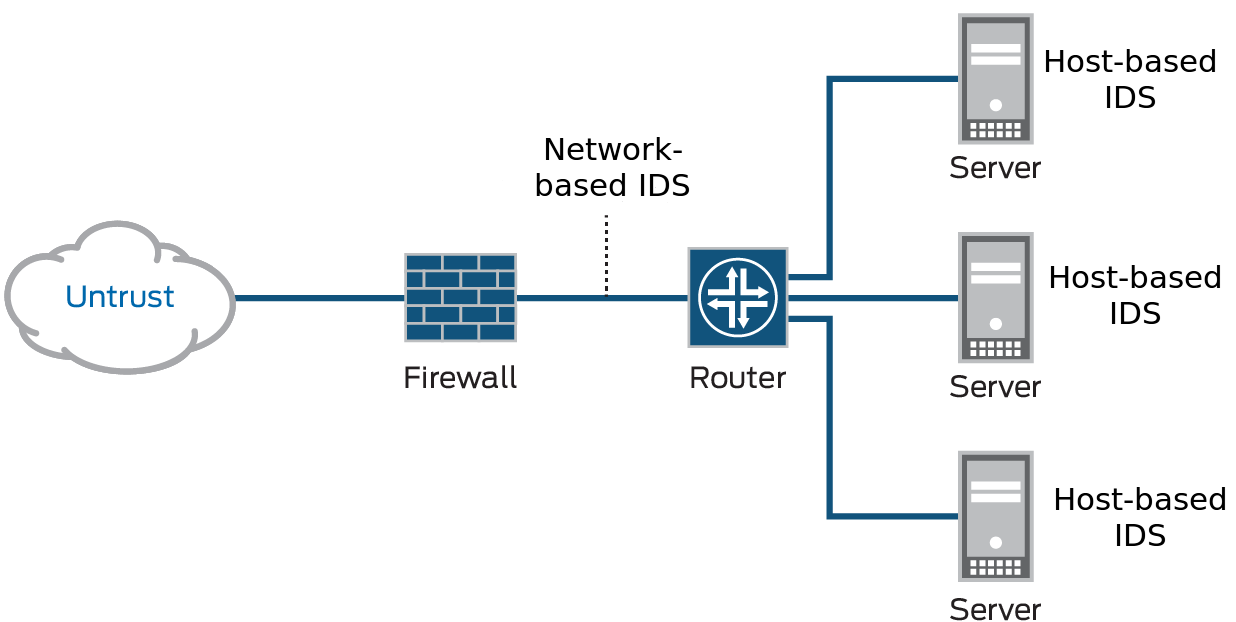
IDS come in a variety of “flavors” and approach the goal of detecting suspicious traffic in different ways. There are network based (NIDS) and host-based (HIDS) intrusion detection systems. There are IDS that detect based on looking for specific signatures of known threats- similar to the way antivirus software typically detects and protects against malware- and there are IDS that detect based on comparing traffic patterns against a baseline and looking for anomalies. There are IDS that simply monitor and alert and there are IDS that perform an action or actions in response to a detected threat.
A typical computer network has several access points to other networks, both public and private. The challenge is maintaining the security of these networks while keeping them open to their customers. Currently, attacks are so sophisticated that they can thwart the best security systems, especially those that still operate under the assumption that networks can be secured by encryption or firewalls. Unfortunately, those technologies alone are not sufficient to counter today’s attacks.
1.2. What Can You Do with IDS?
Intrusion detection systems (IDS) constantly watch your network, identifying possible incidents and logging information about them, stopping the incidents, and reporting them to security administrators. In addition, some networks use IDS for identifying problems with security policies and deterring individuals from violating security policies. IDS/IPS have become a necessary addition to the security infrastructure of most organizations, precisely because they can stop attackers while they are gathering information about your network.
1.3. How Does IDS Work?
The three IDS detection methodologies are typically used to detect incidents.
- Signature-Based Detection compares signatures against observed events to identify possible incidents. This is the simplest detection method because it compares only the current unit of activity (such as a packet or a log entry, to a list of signatures) using string comparison operations.
- Anomaly-Based Detection compares definitions of what is considered normal activity with observed events in order to identify significant deviations. This detection method can be very effective at spotting previously unknown threats.
- Stateful Protocol Analysis compares predetermined profiles of generally accepted definitions for benign protocol activity for each protocol state against observed events in order to identify deviations.
1.4. EniWARE Implementation of NIDS
In this documentation is demonstrated а network intrusion detection system (NIDS). NIDS is deployed at a strategic point or points within the network, where it can monitor inbound and outbound traffic to and from all the devices on the network. You can selectively enforce various attack detection and prevention techniques on the network traffic passing through your chosen device. You can define policy rules to match a section of traffic based on a zone, a network, or an application, and then take active or passive preventative actions on that traffic.
The main idea in this particular case is to monitor and analyze traffic from an industrial controller. Data is collected, analyzed and sent to a remote server where it is processed and visualized.
The network architecture shown in the figure below is used for demonstration purposes.
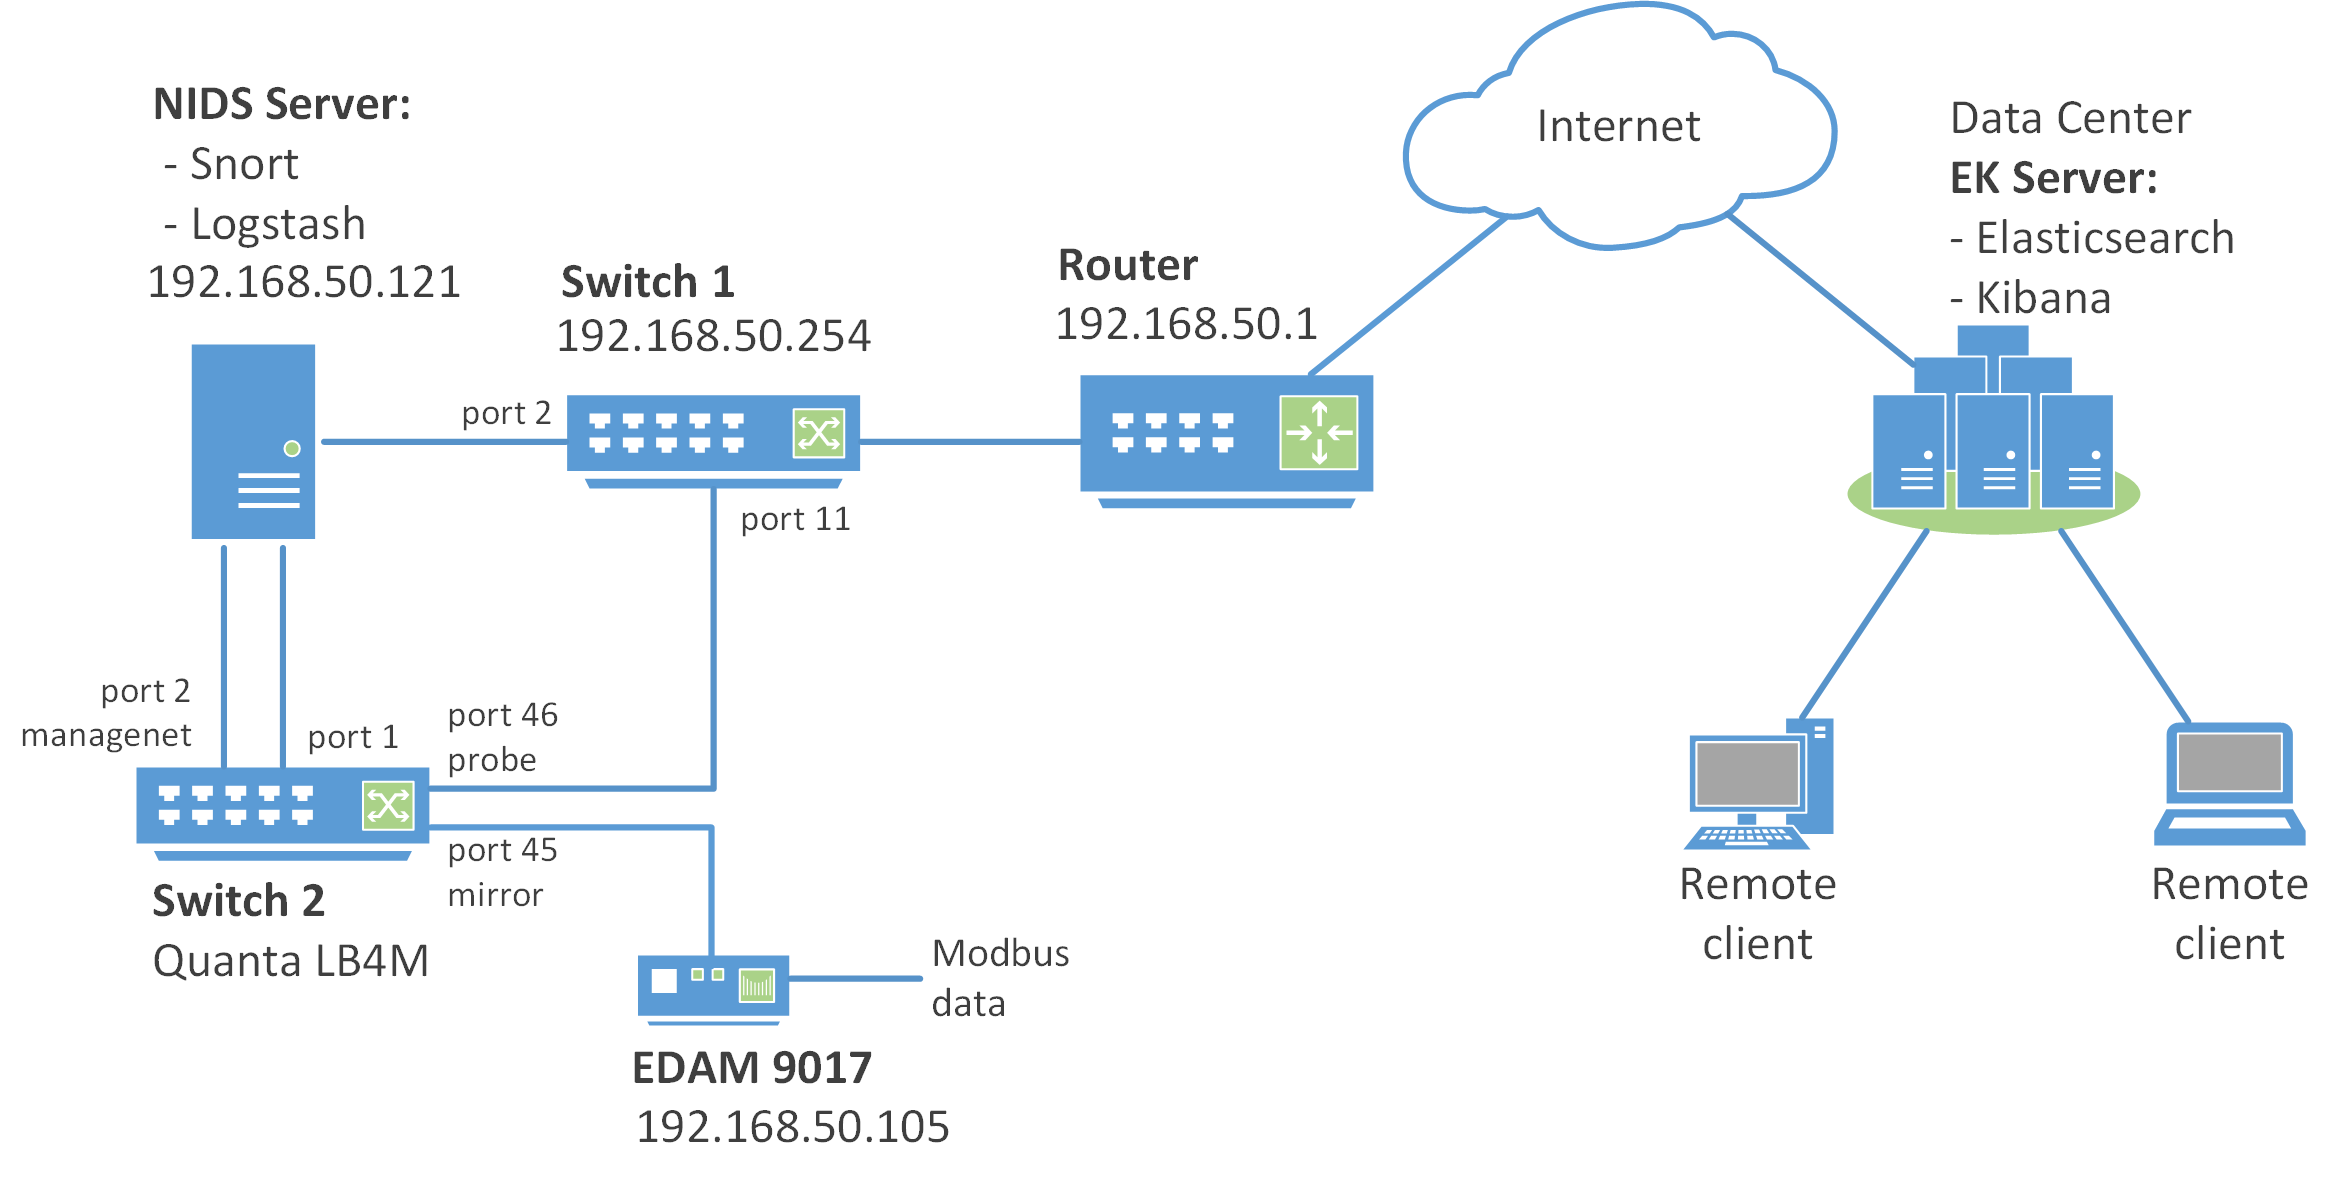
The NIDS is implementet by using Switch 2 which is Quanta LB4M with appropriate firmware installed (see 2.2. Flashing Routing Firmware), and NIDS Server.
Switch 2 listens to the EDAM module traffic and sends it for analysis to the NIDS Server.
The NIDS Server is implemented on a virtual machine with Ubuntu 16.04 LTS Server installation and it uses the following software tools:
- Snort & TShark;
- idstools;
- Logstash.
Snort is a free open source network intrusion detection system. Snort’s open source network-based intrusion detection system has the ability to perform real-time traffic analysis and packet logging on Internet Protocol (IP) networks. Snort performs protocol analysis, content searching and matching. Snort is configured in network intrusion detection mode. In this mode, the program will monitor network traffic and analyze it against a rule set defined by the user. The program will then perform a specific action based on what has been identified. Snort can be downloaded from here. More information can be found in the Snort Documentation.
TShark is a network protocol analyzer. It lets you capture packet data from a live network, or read packets from a previously saved capture file, either printing a decoded form of those packets to the standard output or writing the packets to a file.
idstools is a Python library for working with Snort and Suricata logs and rules. Since the “native” Snort log format is unified2, it is necessary to convert it to JSON. For this purpose, the u2json tool is used (a stript, which is part of the idstools). More information can be found in the official documentation of the idstool project.
Logstash is an open source tool for collecting, parsing, and storing logs (JSON files from Snort in this example) for future use. For Logstash Download, please visit download page. More information can be found in the Logstash documentation.
EDAM 9017 (Ethernet to Analog I/O Modules ) is a compact and lightweight data acquisition module which communicates via Modbus over Ethernet TCP/IP connection.
Remote data processing and visualization is performed by the Elasticsearch and Kibana installed on the remote server (EK Server in the network architecture diagram).
Elasticsearch is a distributed, RESTful search and analytics engine.
Kibana is a web interface that can be used to search and view the logs that Logstash has indexed. Kibana lets you visualize your Elasticsearch data and navigate the Elastic Stack.
Elasticsearch, Logstash, and Kibana, when used together is known as an ELK stack.